

Does China Underconsume?
Misadventures in Alternative Data


It’s now become an economic truism that China underconsumes: that Chinese households consume far less than those from countries with similar incomes.
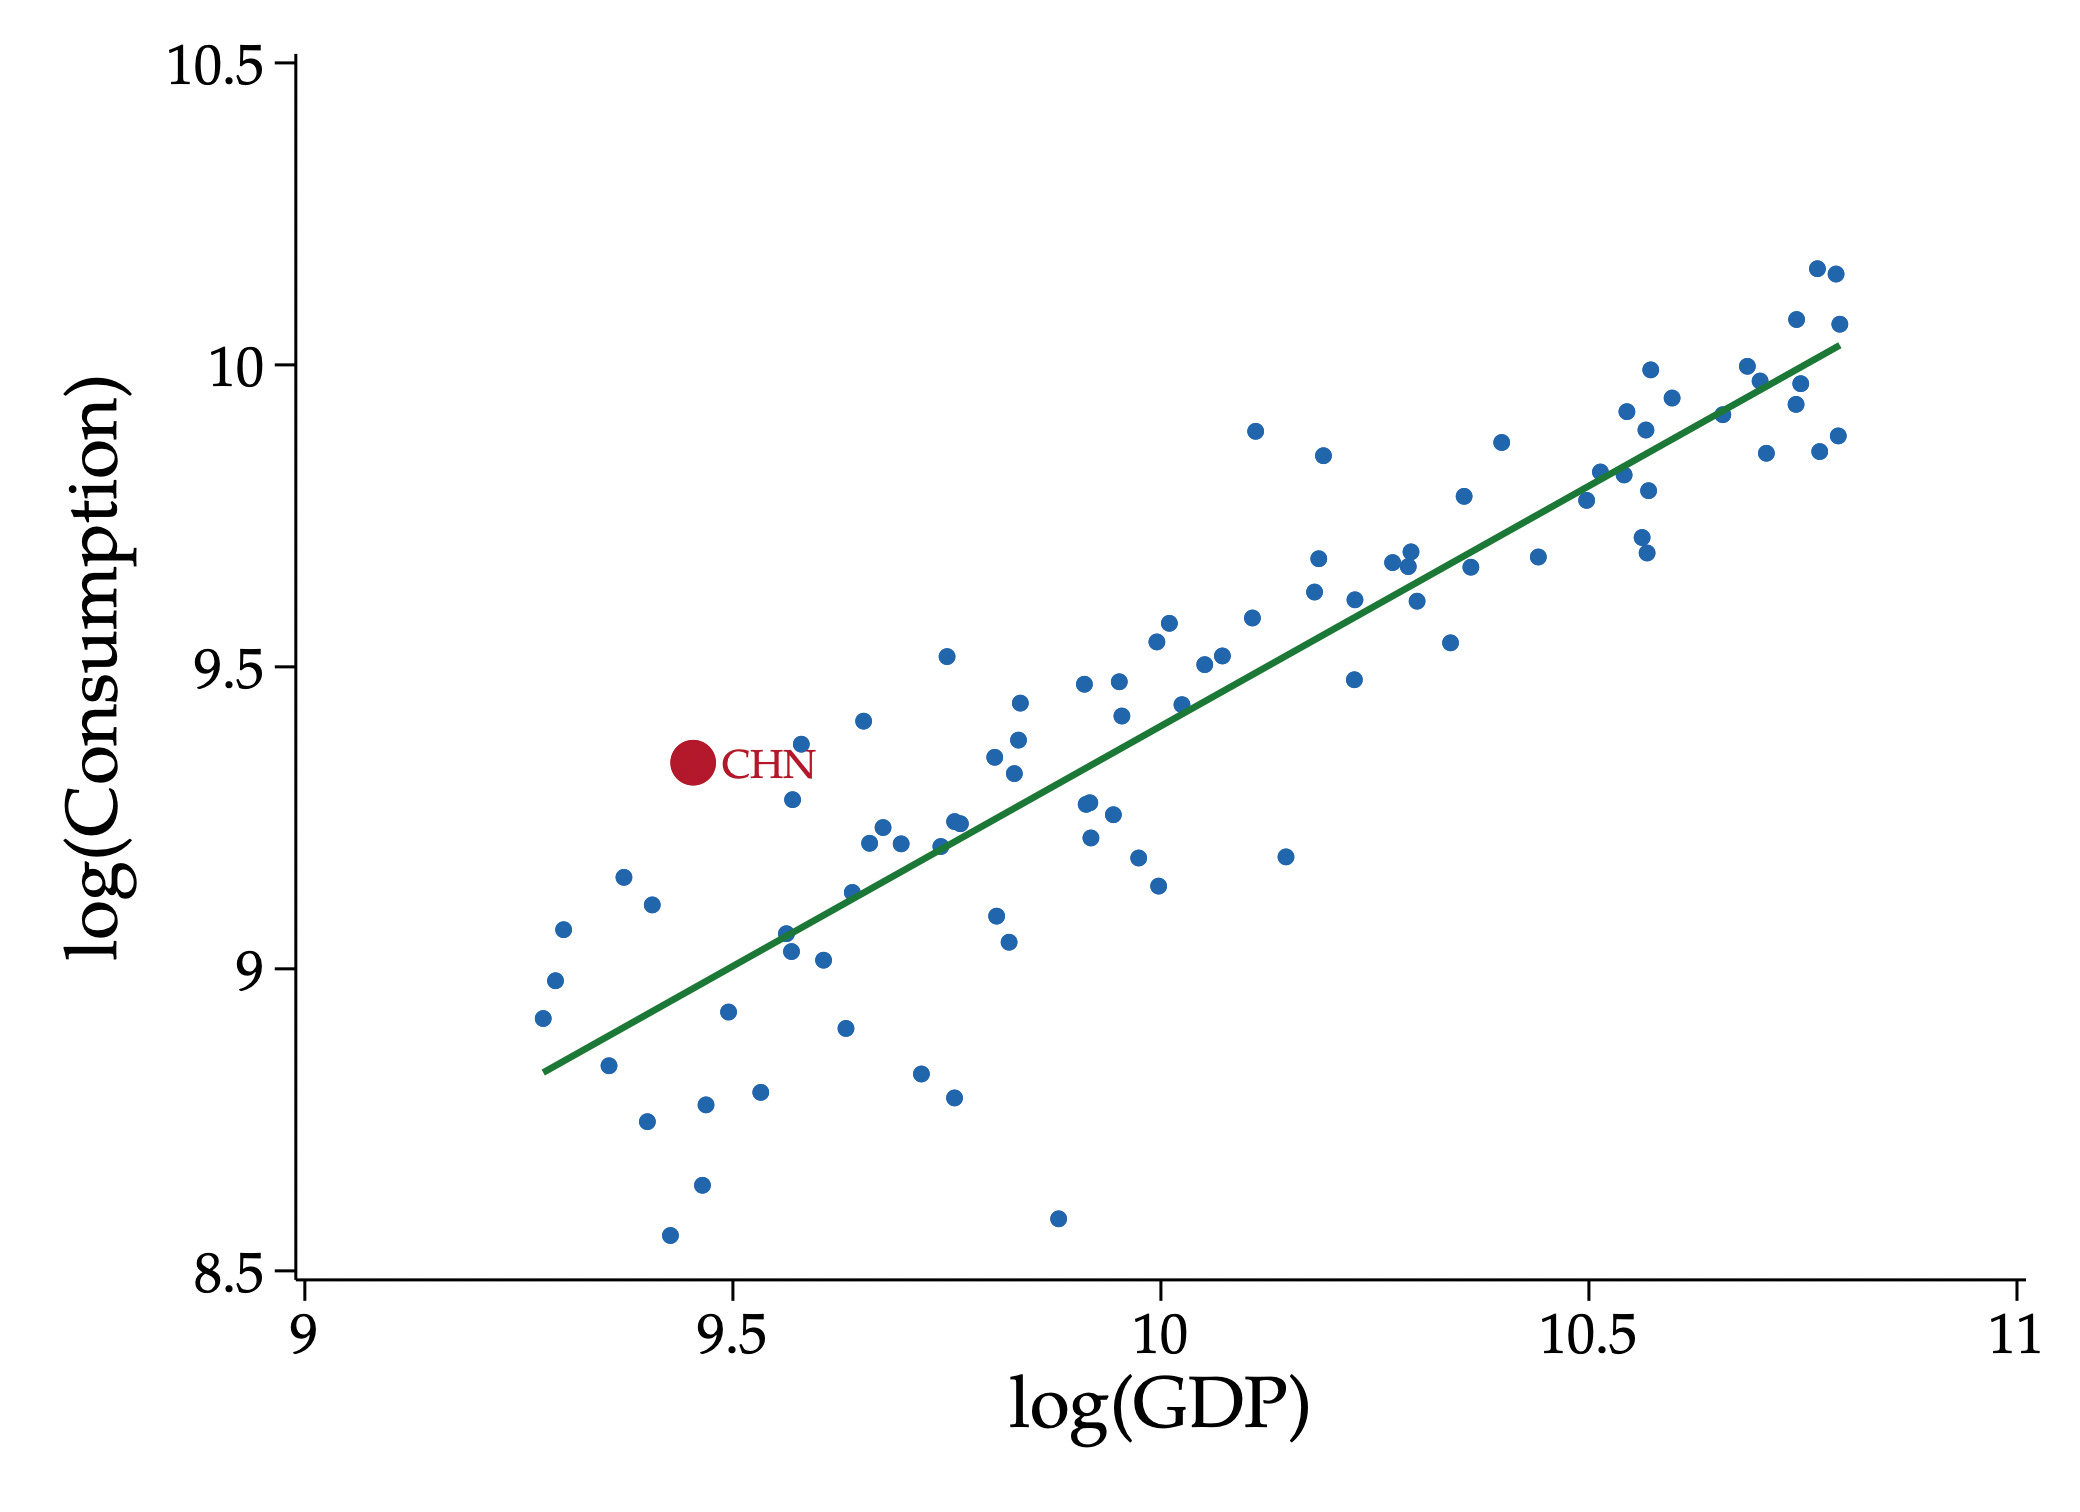
Here’s the problem, illustrated in this New York Fed graph of middle-income countries’ consumption versus their GDP per capita:
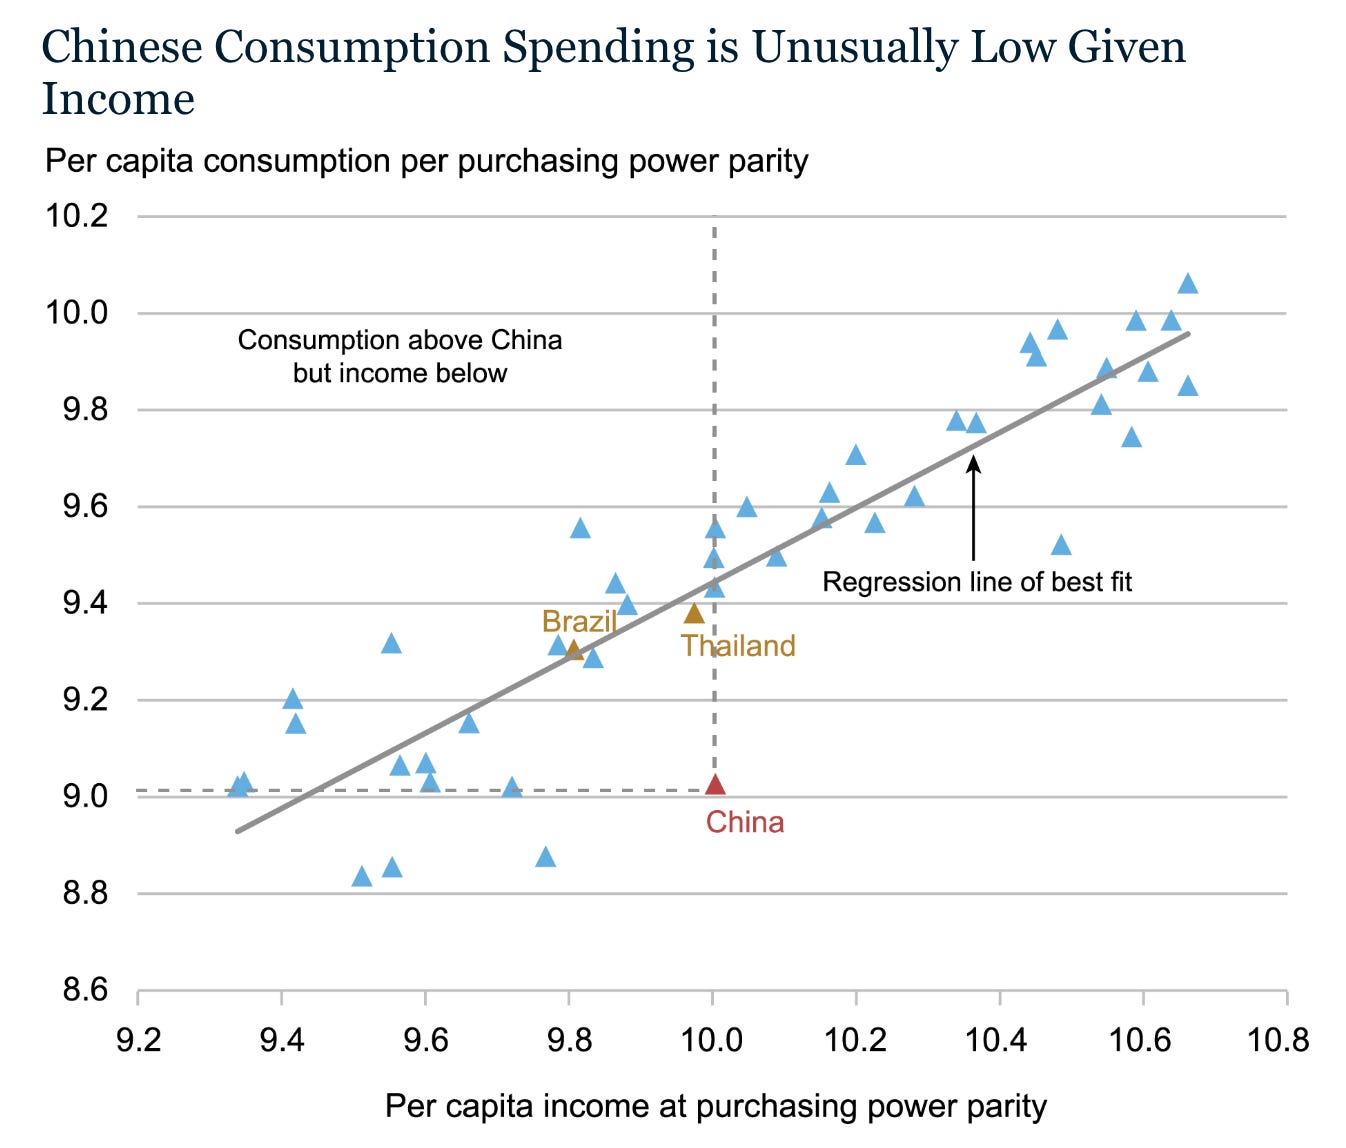
If we trace the red Chinese triangle up to the line of best fit which prevails for other countries, China’s consumption is too low by around half.
Underconsumption is far from an econ nerd curio. It’s the stuff of geoeconomic—and, dare I say it—world-historical importance. By underconsuming and oversaving, the theory goes, China can pump more of its GDP into investment, building the factories and laying down the infrastructure that reinforce its dreaded production “overcapacity”. And since the total amount of savings and investment in the world have to equal, in this viewpoint Chinese underconsumption has a bizarro reflection in American overconsumption, whose symptoms are chronic trade deficits and the decline of manufacturing.
Addressing foreign imbalances has recently, if you’ve noticed, become a major theme of American economic policy. But it’s worth dwelling a bit on what underconsumption means from the Chinese side. What goods are Chinese people not buying enough of?
As it turns out, by following this trail and employing a bit of economic detective work, we can shed new light on the underconsumption thesis.
Turning Up the Volume
Last month, the China Underconsumption debate was jolted back to life by a report in the newsletter Pekingnology, by Yu Fei and Guo Kai of the China Finance 40 Forum:

The heart of CF40’s analysis is this table:
The table is dense, but its message is simple. If we sidestep all the technicalities of cross-country price conversions (what is a purchasing power parity dollar, anyway?) and simply compare the raw volumes of goods that households use, China looks like a fairly consumption-rich society.
In dollar terms, Chinese people consume half as much ($4,936) as Mexicans ($9,688). But Chinese households eat more protein, have more mobile phones (280 per 1,000 vs. 218 per 1,000 in Mexico), and almost as many refrigerators (35.4 per 1,000 vs. 37.8). There are some categories where Mexico is ahead, like items of clothing apparel and laptops, but across the board this does not look like a comparison where one country is half as rich as the other.
The conclusions the authors lay out are stark:
Overall, we believe that China's per capita consumption level should actually be higher than that of Mexico (approximately $10,000), rather than just 50% as indicated by the per capita consumption expenditure. It should also reach at least 40%-50% of the levels of major developed countries such as Japan, Germany, and France, rather than the 20%-30% shown by the expenditure figures. If measured in terms of physical consumption volume, China's consumption level might be about double the current level indicated by expenditure data.
These are massive claims. Here’s a quick bit of napkin math using the Penn World Tables: 39% consumption share * $20 trillion GDP = $7.8 trillion in 2017 PPP dollars. If China’s consumption is underestimated by half, we’re undercounting global GDP by around 6%. It’s as if, when tallying up the global economy, we forgot to count both Germany (GDP: $4.3 trillion) and the United Kingdom ($3.1 trillion), with room to spare for Peru ($400 billion).
What’s Your Engel?
The Pekingnology newsletter sparked an idea. Can we look more deeply at spending behavior on a key good to see if it sheds light on overall Chinese consumption?
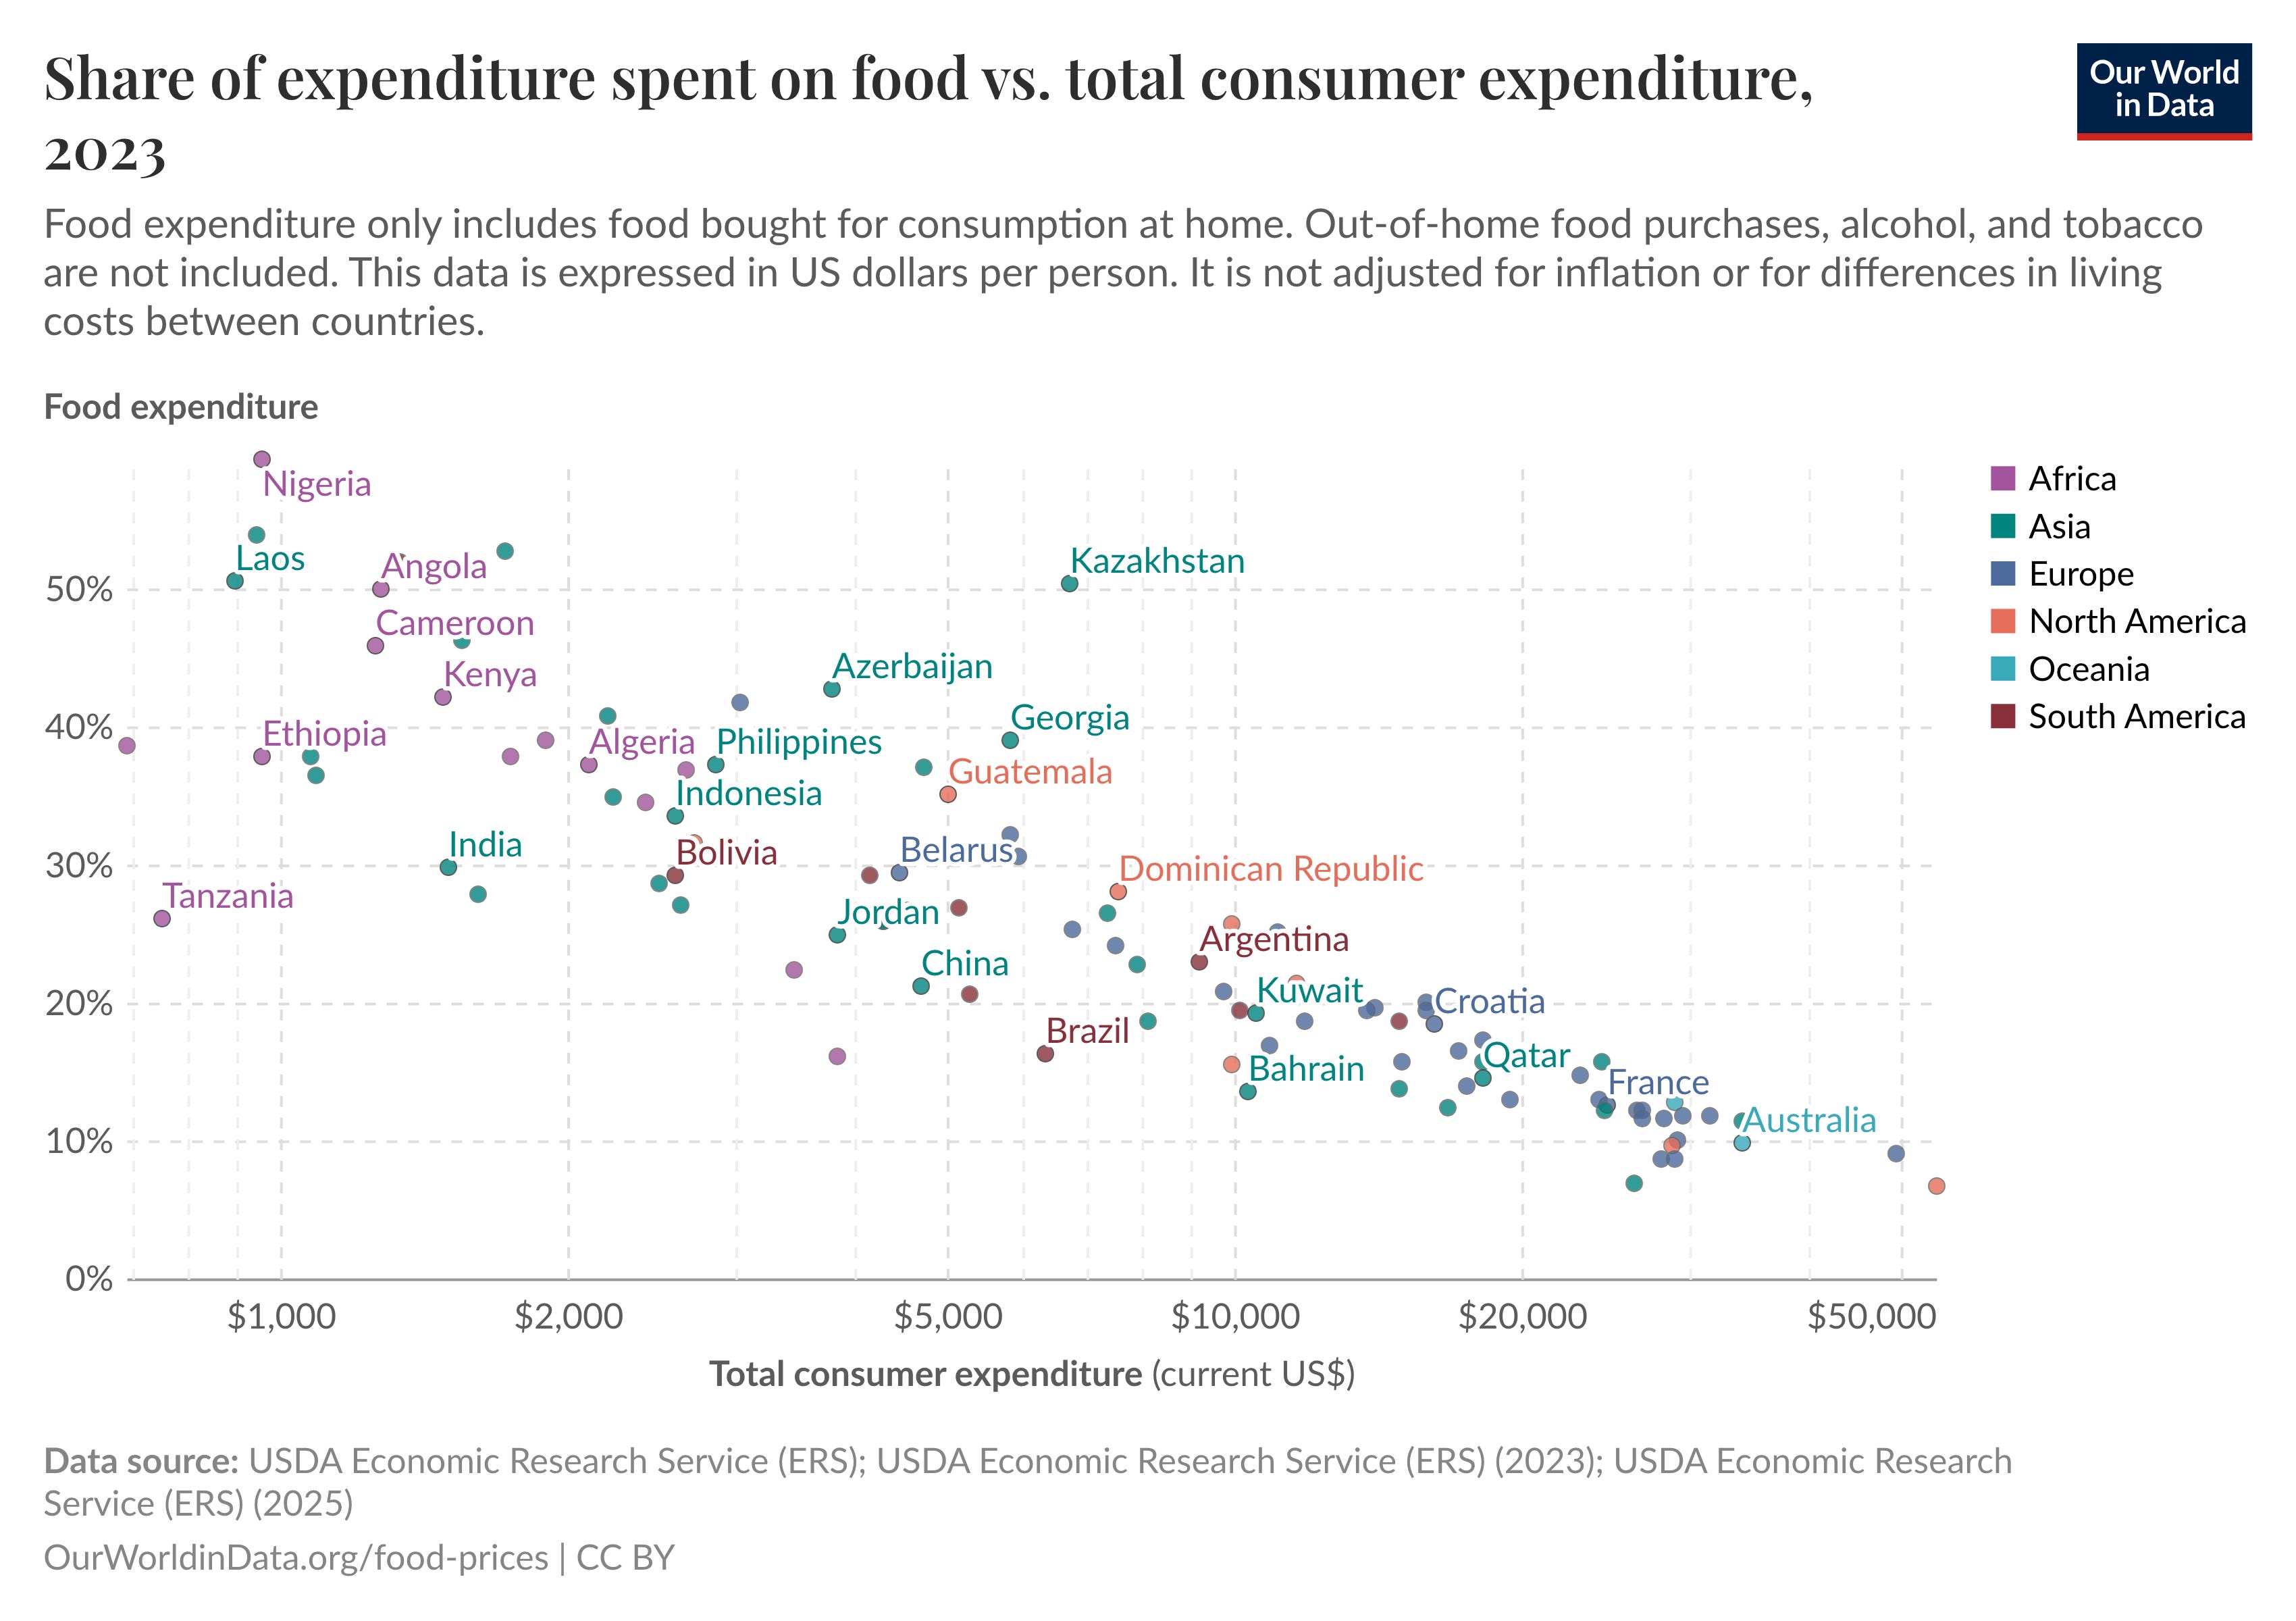
A handy trick in the development economist’s toolkit is the Engel Curve: the observation that, as households and countries get richer, they spend a smaller share of their consumption on food.1 This is one of those rare economic regularities that crops up again and again in the data:
Nakamura, Steinsson, and Liu (2016) show how we can deploy Engel curves to sniff out anomalies in Chinese price data.2 (Skip to the *** below if you don’t want the technical details.) Below are Chinese Engel curves in 1995, 1998, and 2000, plotting the share of household consumption spent on food against real total expenditures:
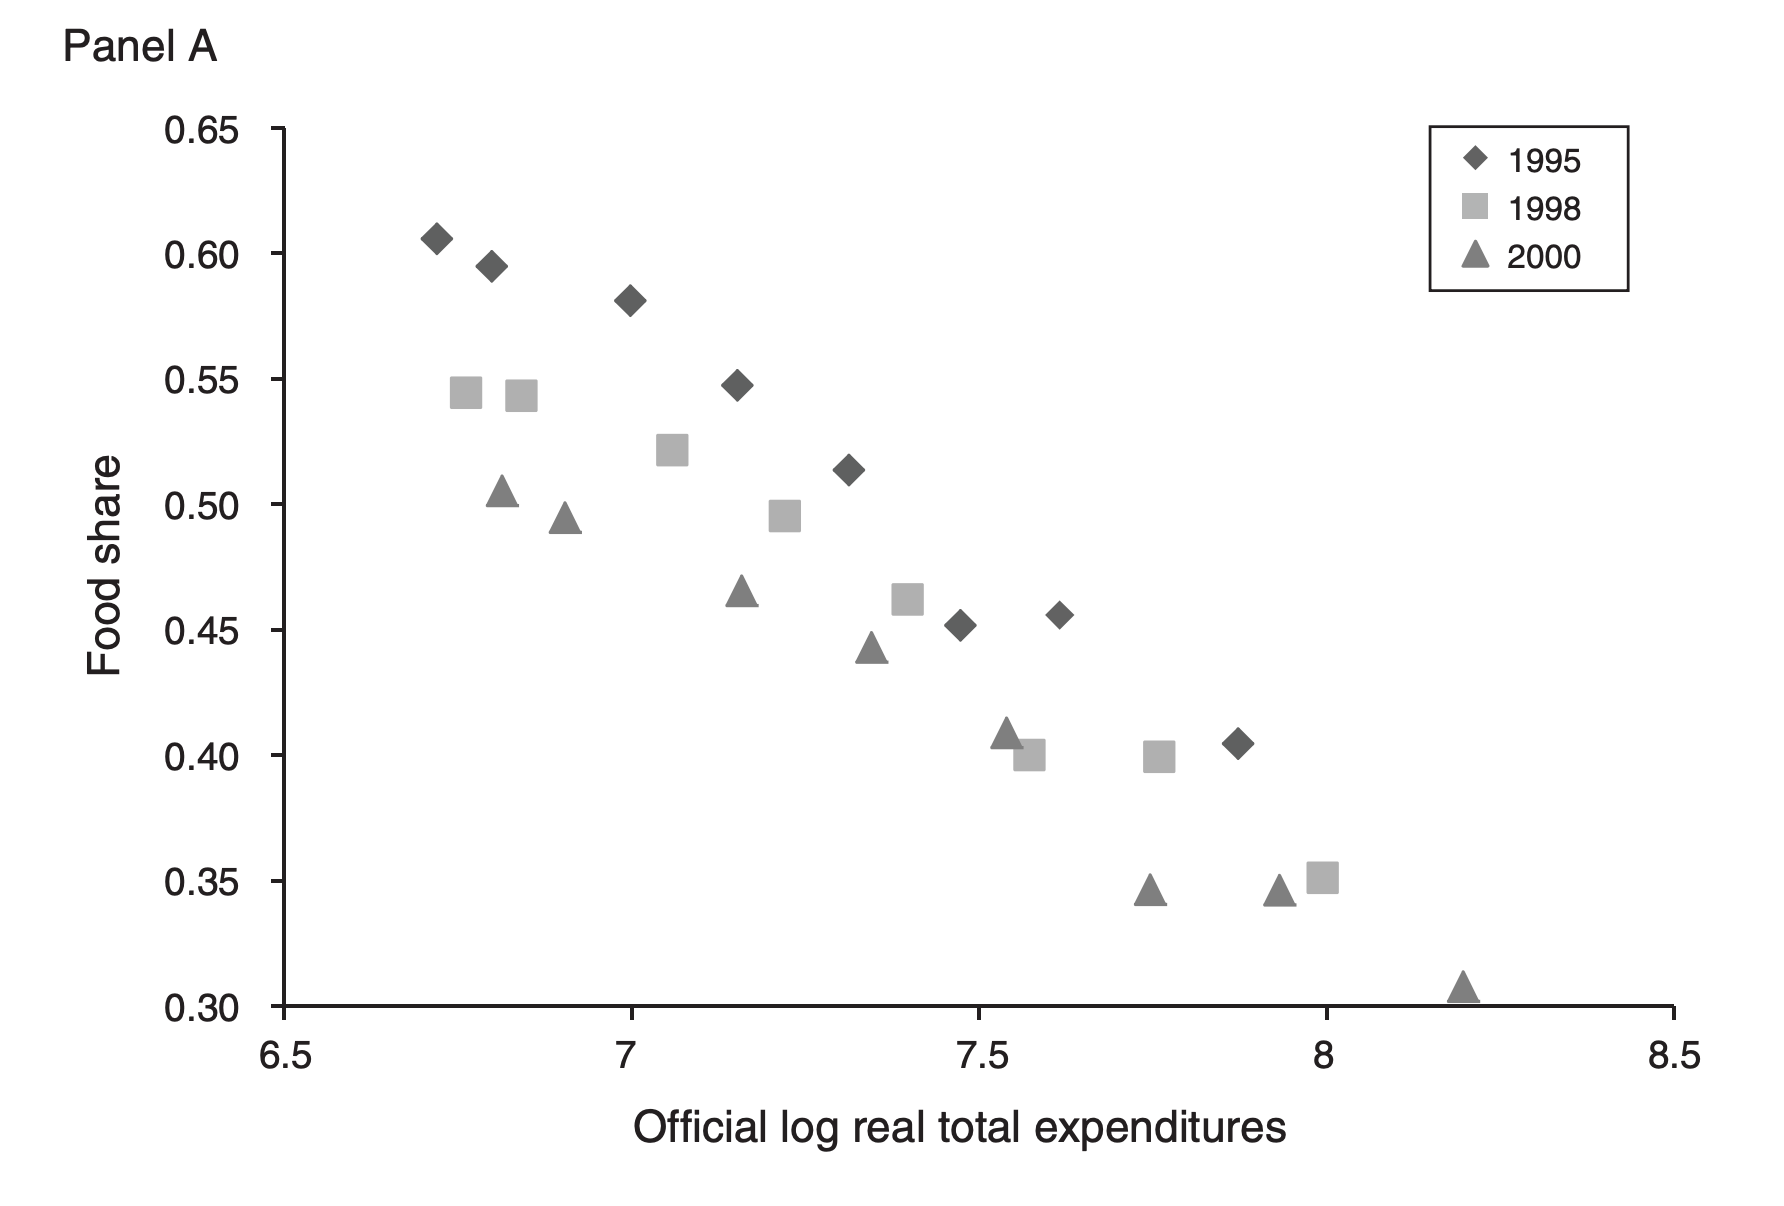
Notice how the lines shift down and leftward from 1995 to 2000? A lower Engel curve means that households spend a smaller share on food for a given amount of total real expenditures (which are deflated using official Chinese inflation data).
Why did the Engel curves shift at such a fast pace? It doesn’t seem likely that the consumption habits of Chinese households should vary so much from year to year. The parsimonious explanation, Nakamura, Steinsson, and Liu argue, is that the official Chinese price data is biased. In this case, if the inflation used to deflate total expenditures is systematically overestimated, then real expenditures are underestimated—which would explain why the Engel curve has shifted down!
(It’s worth noting that biased inflation is not a problem specific to China; this method was invented to detect upward biases in US CPI.)
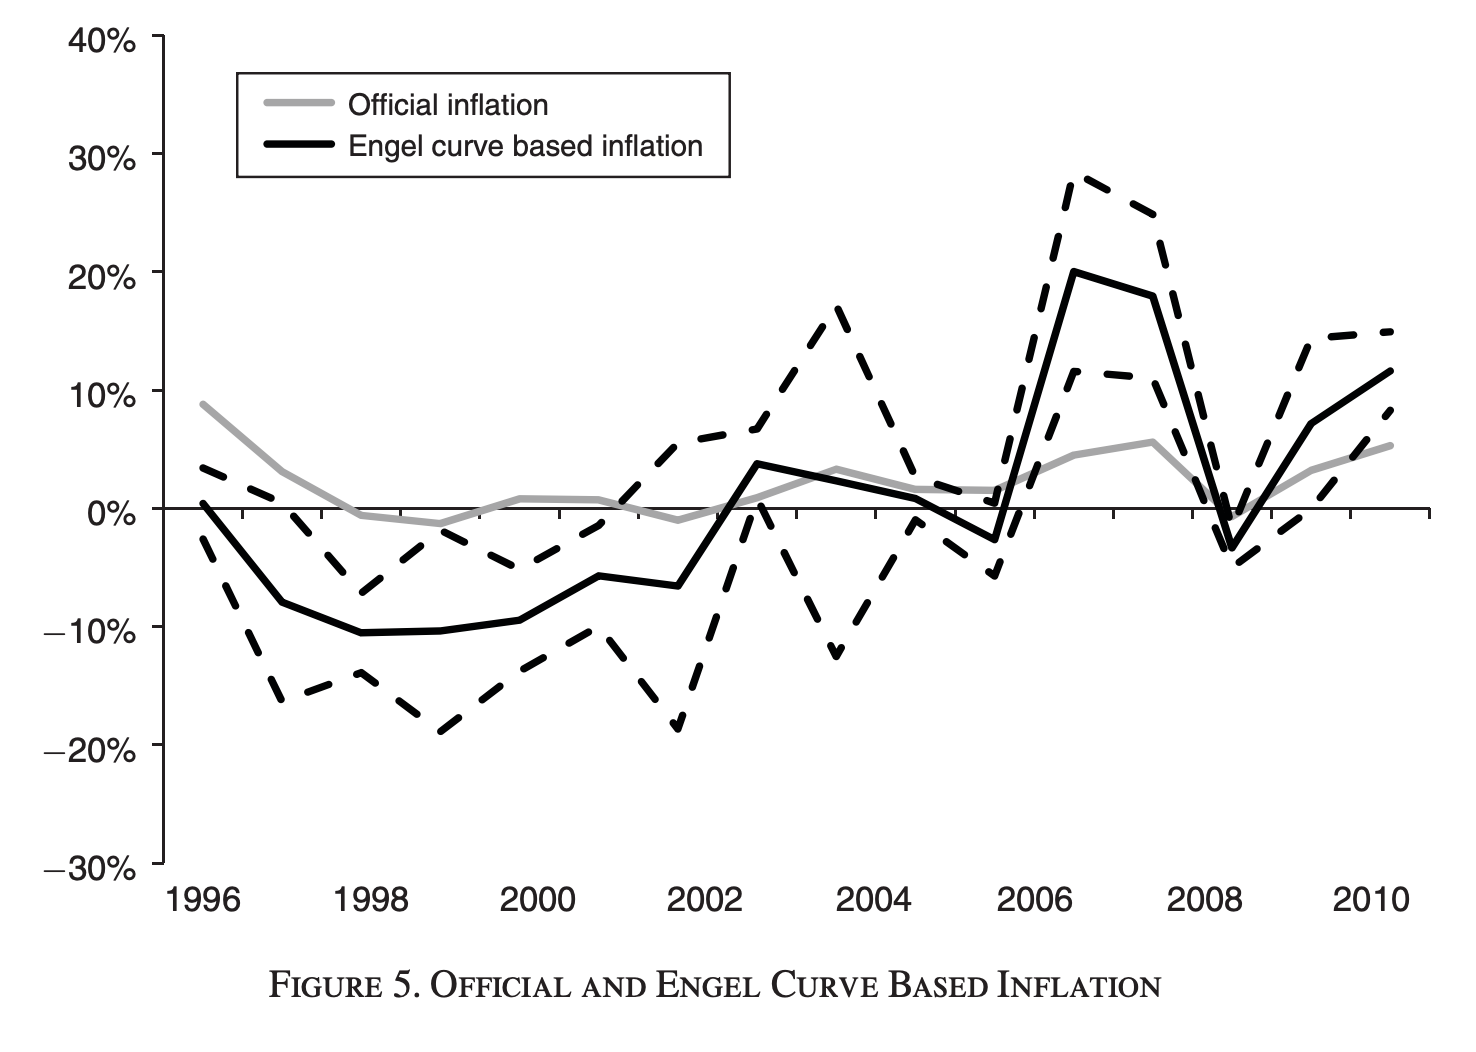
By observing how Chinese Engel curves shift up and down, Nakamura, Steinsson, and Liu can back out their own measure of inflation, completely independent of the Chinese official statistics. They find inflation that is significantly more volatile than the official metrics:3
These inflation series can then be used to deflate nominal expenditures to get real consumption.
***Wonky bit ends here***
Nakamura, Steinsson, and Liu’s headline finding is that Chinese consumption growth was likely significantly understated in the 1990s, and overstated in the 2000s:
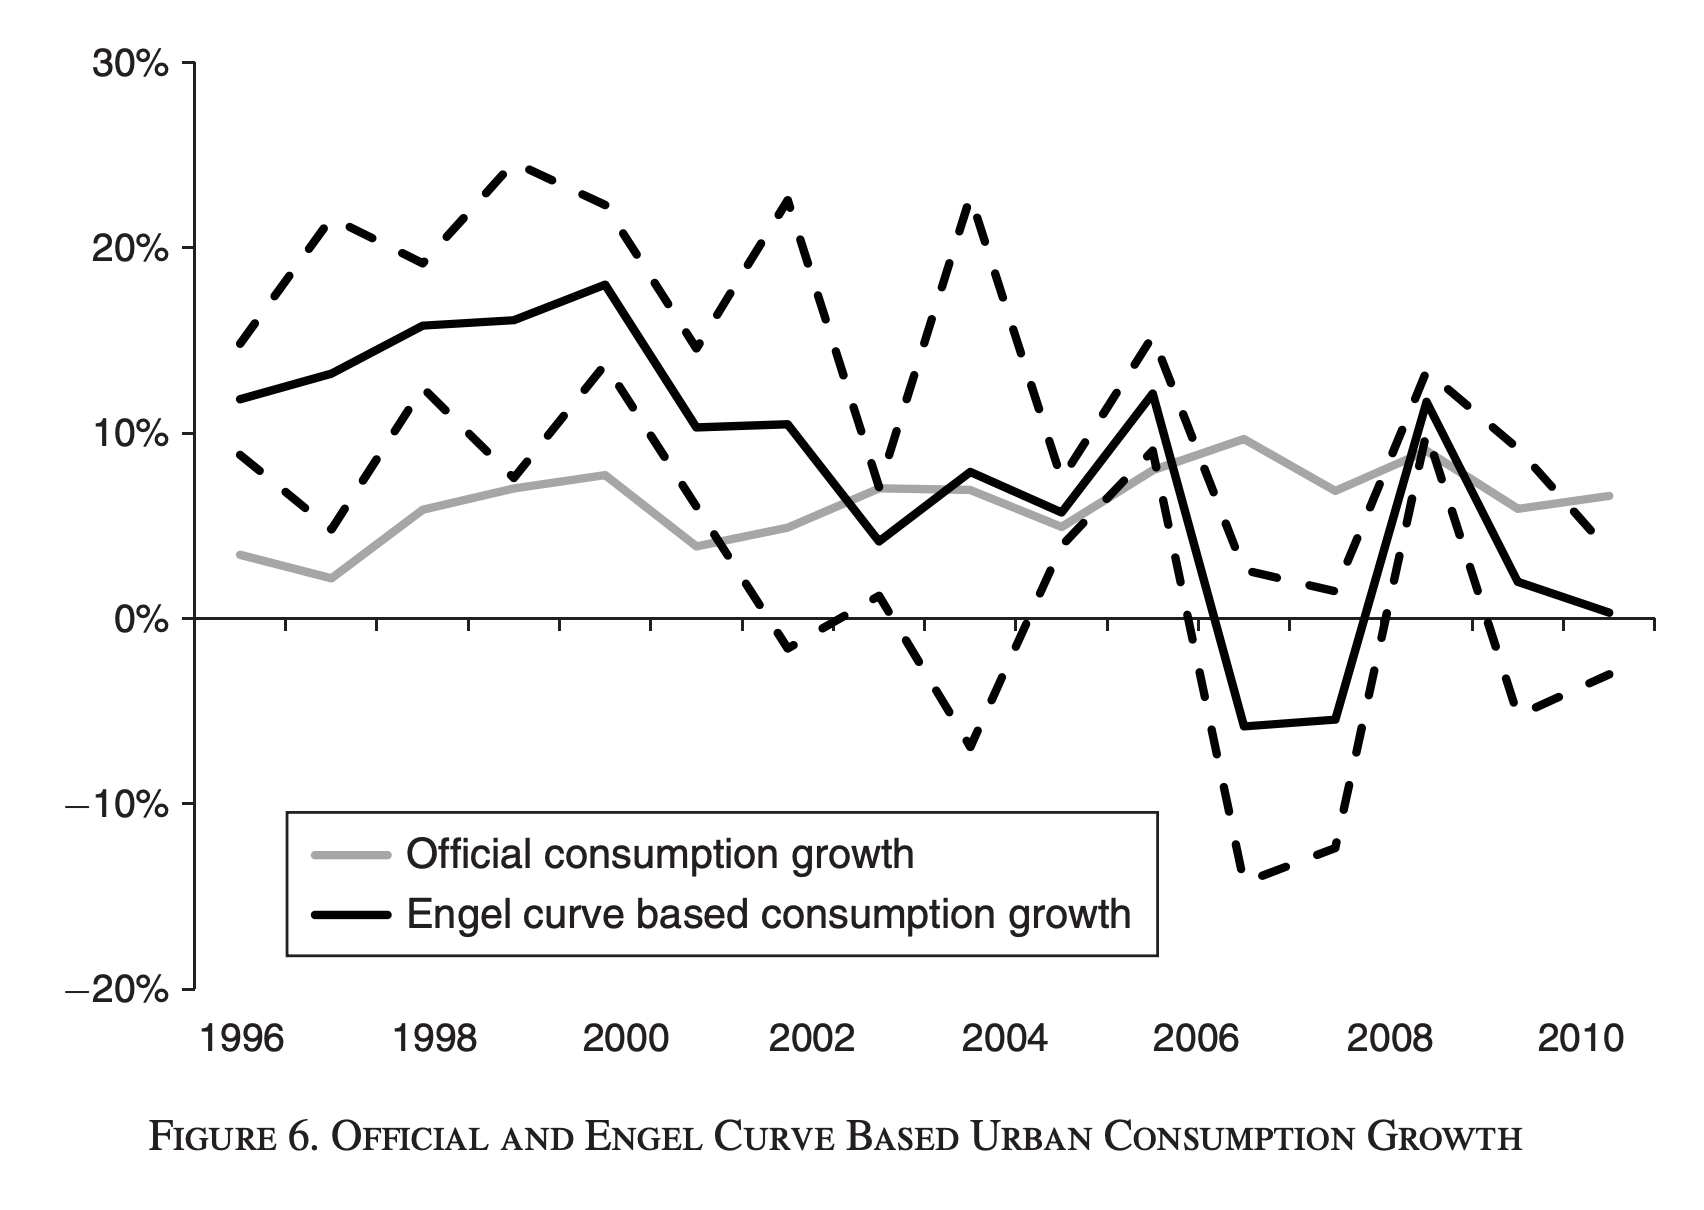
Official consumption growth was 163% between 1995 and 2011. Tallying up all the fluctuations, Nakamura, Steinsson and Liu’s series implies that actual consumption growth was 210%, or 47 percentage points higher.4
Some caveats are in order. Note that an Engel curve is not based on any theory, but an empirical regularity that we’ve reified, solidified, congealed into a stylized fact. Perhaps it is true that Engel curves move around; those shifts are indistinguishable in our data from price changes. The paper’s data also spans only 1995-2011. Perhaps the original price level in 1995 was overestimated. Most of all, there’s been another decade of Chinese growth since—it’s possible that recent inflation has been underestimated, cancelling out these gains.5
On the other hand, if the present results hold, then we’re halfway to explaining China’s consumption gap with Mexico.
The View From Outer Space
Notice that up to this point we’ve been solely focused on consumption. But underconsumption is a relative concept; what matters is consumption relative to other countries at similar incomes.
Estimating the true level of Chinese GDP is unfortunately not just a well-established problem; it is a cottage industry keeping an army of intelligence analysts gainfully employed. Even official Chinese sources sometimes have trouble keeping things straight. For a time, provincial GDPs added up to a number larger than national GDP, and former Premier Li Keqiang is said to have preferred an index of railway cargo, electricity consumption, and bank loans to the official GDP numbers.
Perhaps the most interesting recent academic attempt is Martinez (2022), which uses nighttime satellite imagery to measure national GDP. I have some statistical qualms with economists’ growing infatuation with nightlights as a data source; that’s a subject for another post. But it’s generally true that, as places grow richer, putting up streetlights and neon signs, they appear brighter at night:
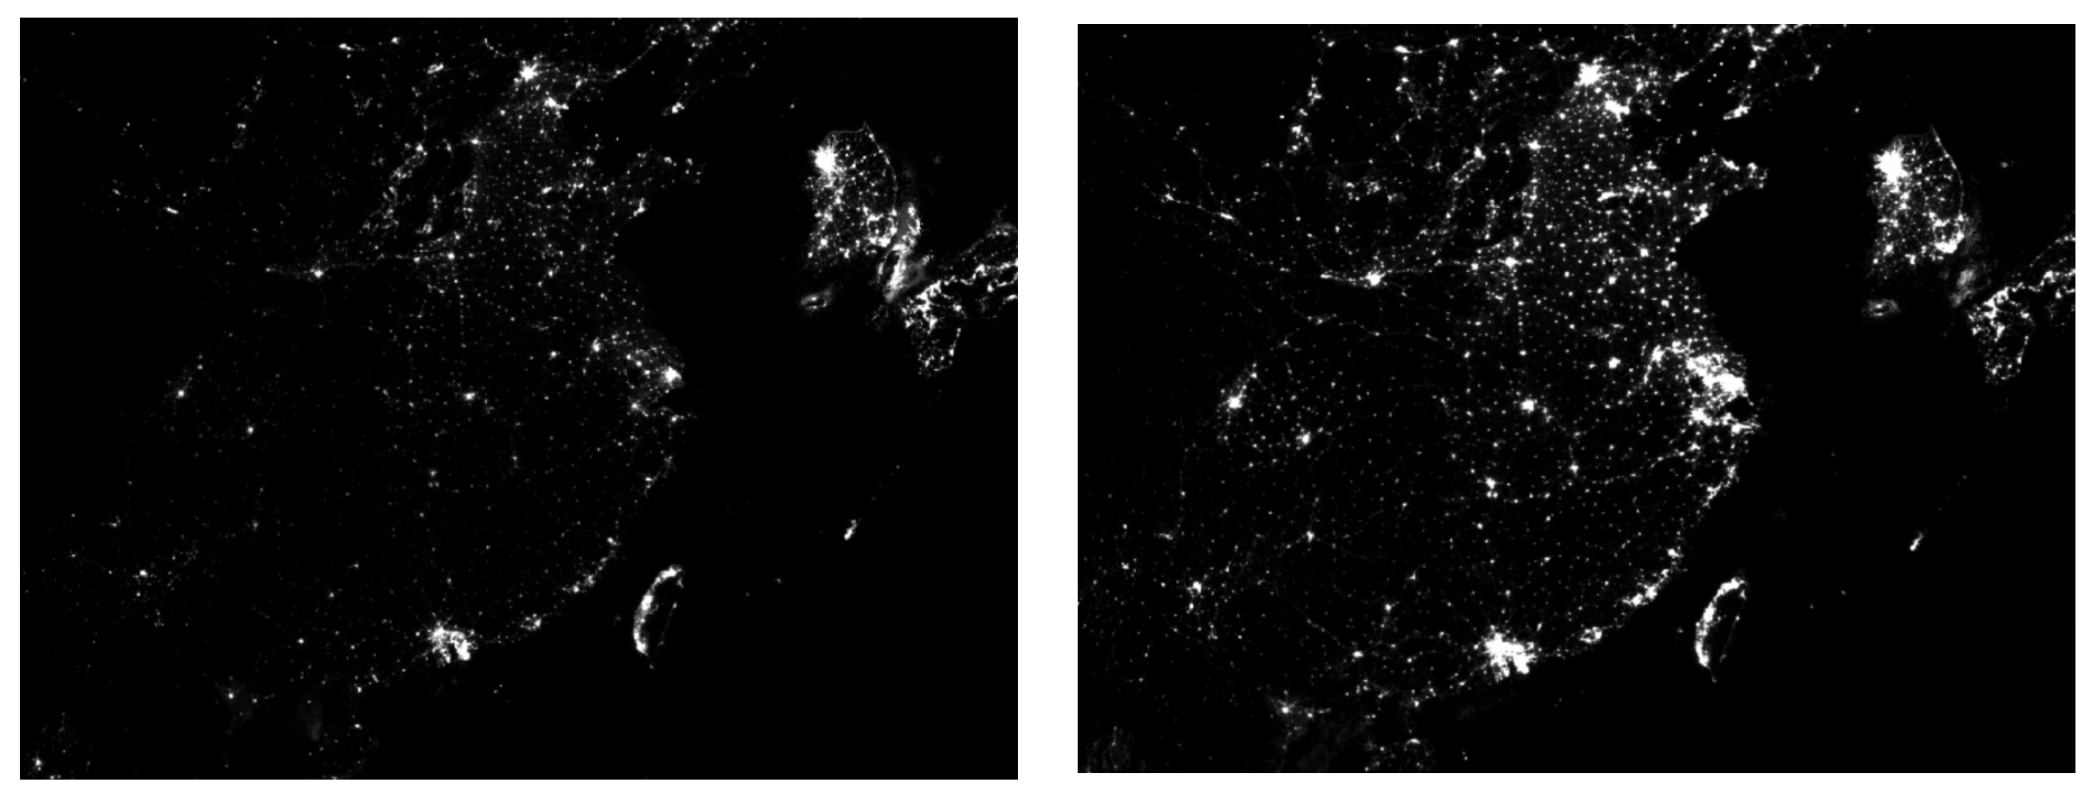
Martinez’s discovery was to realize that autocracies and democracies behave differently when viewed from outer space. For each percentage increase in GDP, nighttime lights in autocracies grow less than those in democracies. If we believe that nightlights are an impartial read of economic activity on the ground, while GDP statistics are fashioned from the crooked timber of humanity, this suggests, not implausibly, that autocratic regimes are more likely to be fudging their GDP numbers.
Moreover, of the components of GDP, investment and government spending appear to be systematically overestimated in autocracies, while consumption is not (Table 2). This is doubly helpful. First, investment and government spending are plausibly easier variables for governments to manipulate than household spending, strengthening the evidence in favor of autocratic meddling. And second, if GDP is overestimated versus nightlights, while consumption is not, this may help explain China’s purported underconsumption.
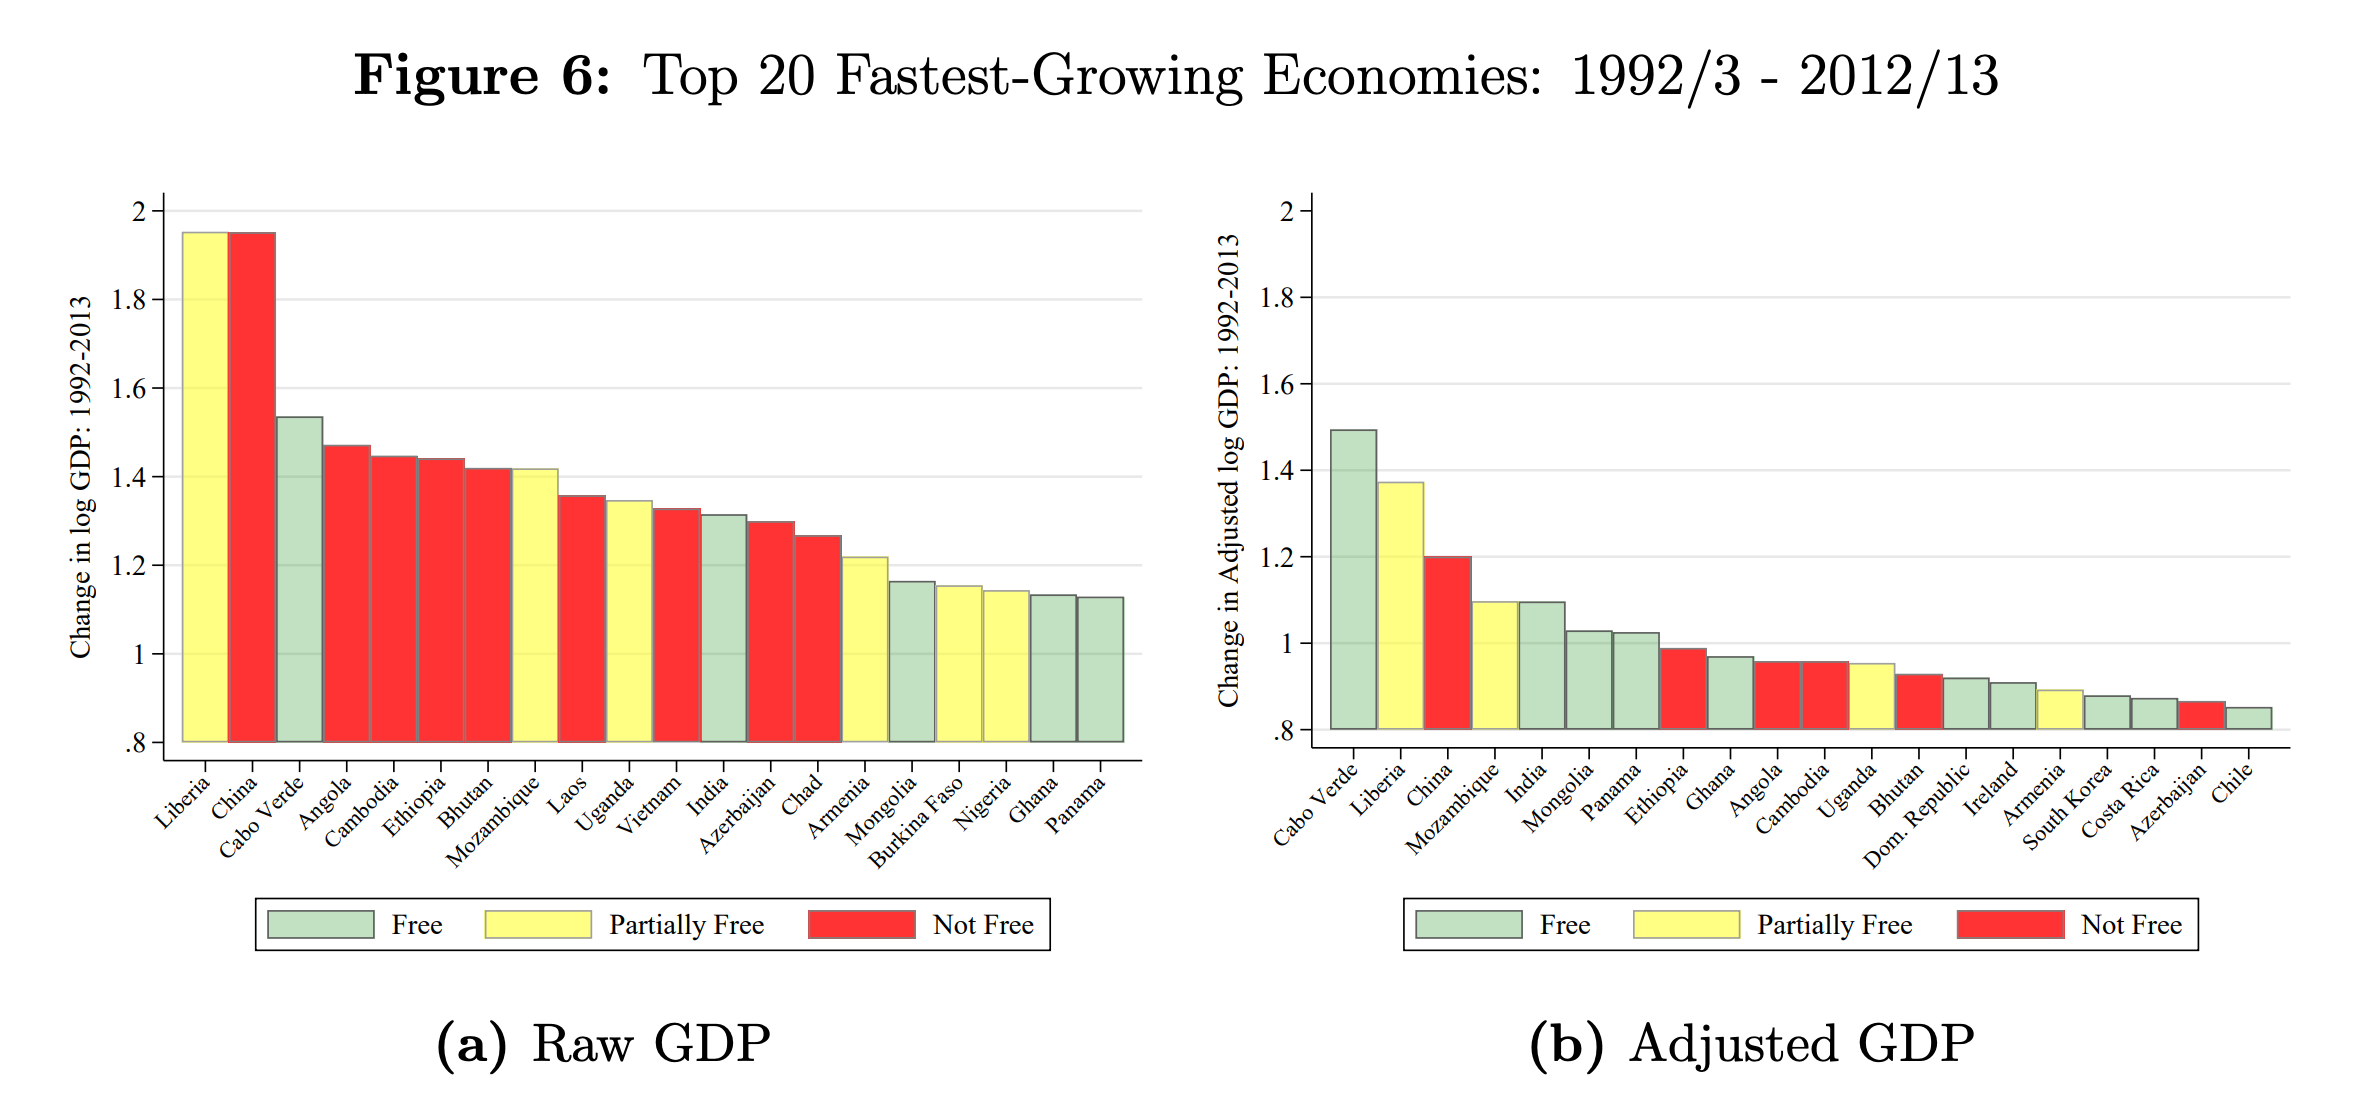
After statistically adjusting for autocracies’ bias, Martinez finds that China’s GDP growth from 1992 to 2013 was likely overstated by 60%:
I have some skepticism about the scale of this figure—60% is a huge revision. But if we take this adjustment seriously, combining it with the hypothesized 47% increase in consumption from Nakamura, Steinsson, and Liu (2016), we can return to the chart we began with, putting China in a corrected place:
Perhaps China is not underconsuming at all. Perhaps it is in fact overconsuming, relative to an income level that is much lower than is officially reported.
None of this is meant to be definitive. What I mean to highlight, through all this statistical speculation, is the sensitivity of our presumptions to alternative looks at the data; even the grandest theories are built atop prosaic questions of measurement. There’s a lot more to mine in the theoretical implications of under-consumption. (If there’s reader demand, I can pick this up in a Part II.) But I’ll leave it here for now.
That Chinese underconsumption is possibly the product of undercounting consumption and overestimating GDP strikes me as the perfect sort of compromise—the kind which leaves everyone a little unhappy.
I wrote last year on how Engel curves can explain why industrialization happens.
NB: Nakamura and Steinsson were my professors at Berkeley, and Jón Steinsson served on my dissertation committee.
To me, it’s kind of remarkable is how this backed-out Engel measure genuinely seems to track the official inflation series.
If there’s sufficient demand, I might be able to collect this data and extend the exercise.
Would definitely be interested in whether the post-2011 estimates of inflation affect these results
The problem with having lower GDP, while it makes some other aggregates more plausible, it moves China into a truly horrific debt-to-gdp ratios for a developing country. It get more somewhat more sustainable because the base is factually lower and the growth would be higher, but it's still incredibly bad.